The Dashboard Building Competition is a data-driven event where students transform raw data into powerful insights using Power BI. Participants first attend a hands-on workshop to learn essential tools and techniques after which they are given a real-world dataset to analyze and convert into an interactive, visually compelling dashboard using only their skills, logic, and creativity. The event enhances analytical thinking, data interpretation, visualization design, and business intelligence decision-making. It empowers students to think like data analysts and present insights with clarity and impact.
Prizes:
1st – 10,000 2nd– 4,000 Registration Fees: Rs.300
Round Structure The competition includes two parts:
Workshop Session – Students will attend a hands-on Power BI workshop where they will data cleaning, modeling, visualization techniques, and dashboard design basics.
Dashboard Creation Round – Participants will be given a dataset using which they have to build an insightful, interactive dashboard showcasing their analytical and visual storytelling skills.
Rules and regulations for participants
Participation is allowed individually or in teams of maximum 3 members.
Maximum 30 teams/individual participants.
Open to students from any school / college / course / semester.
Participants must bring their own laptop with Power BI Desktop installed.
Decisions of the organizing committee will be final and binding.
Workshop Session (10:00 am to 12:00 pm) Purpose
This round introduces participants to Power BI fundamentals, ensuring that even beginners can qualify for Round 2. It ensures a level playing field and equips all participants with essential BI skills.
Participants will replicate a trainer-designed sample dashboard.
Outcome of Round 1
At the end of the training session, participants will be prepared to independently work on their own dashboards during the final competition round.
Power BI Basics: Data Cleaning & Transformations (Power Query), Visualizations, Data Modeling
DAX Introduction (Basic Level) – Creating a Simple Dashboard
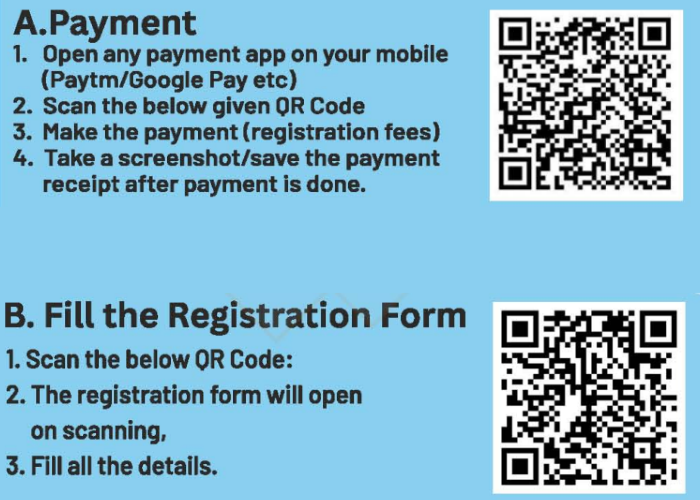
1. Scan QR Code and pay registration fees using any payment app. 2. Take a screen shot of payment receipt. 3. Scan QR Code for registration form, fill it and upload payment receipt.
Payment Registration QR Code
1. Scan QR Code and pay registration fees using any payment app. 2. Take a screen shot of payment receipt. 3. Scan QR Code for registration form, fill it and upload payment receipt.